1 Part 1: structure#
I have an interactive tutorial about making interactive tutorials[3], showing how I made my line drawing tutorial[4]. I wanted to describe how I made interactive diagrams in several other pages. The flow is:
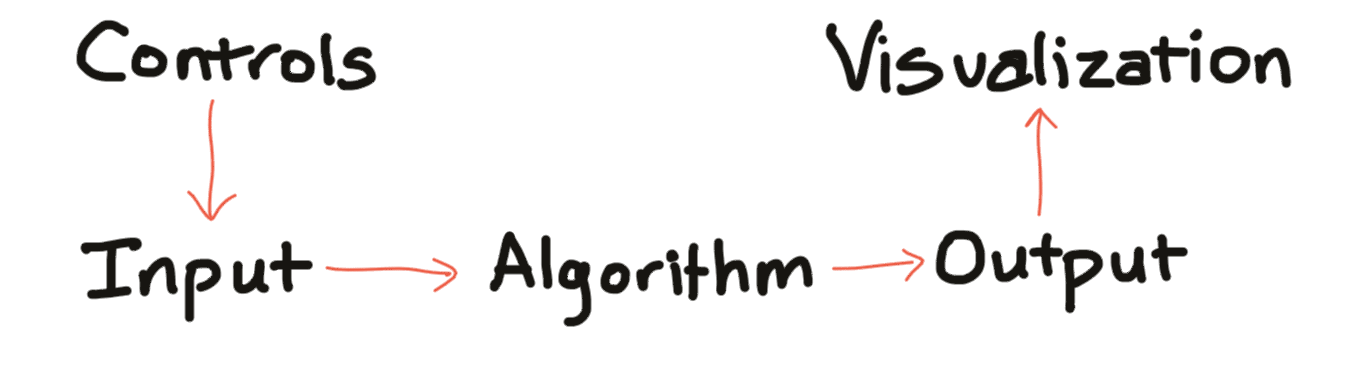
The controls and the visualization are what the user sees. The input, algorithm, and output are running behind the scenes.
Let’s look at some examples.
Here’s a diagram from my On the probability page, the controls are on the left and the visualization is on the right:
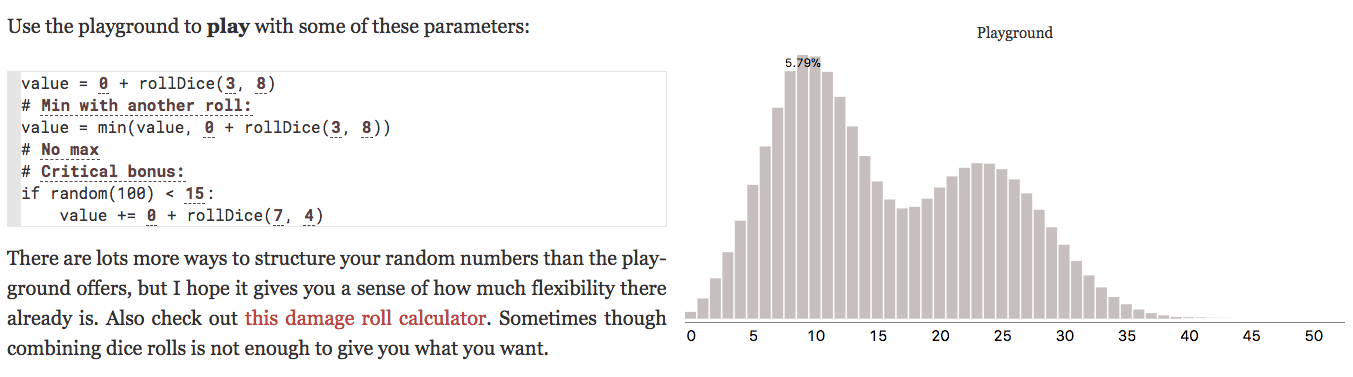
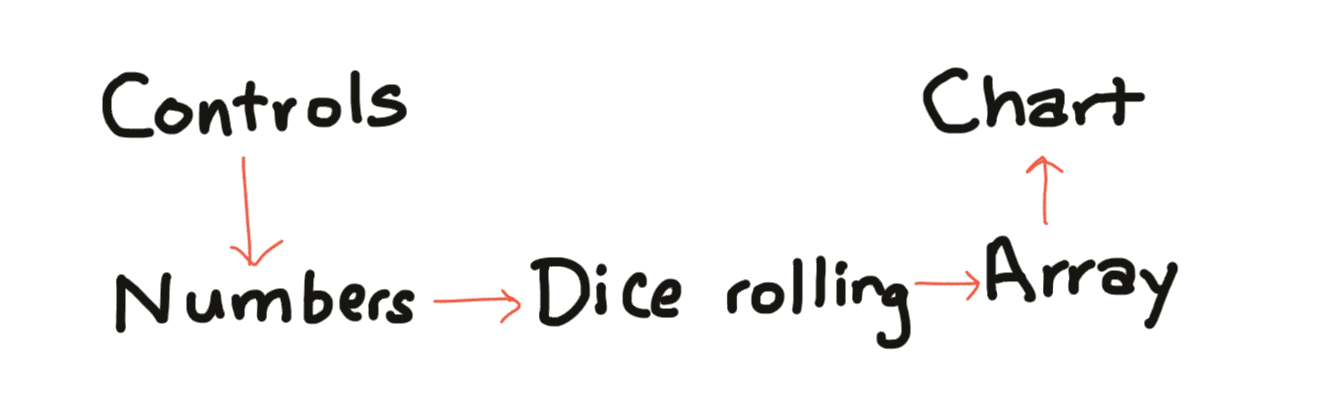
What’s the flow? The controls let you change the parameters, and the parameters feed into the dice roll algorithm, which outputs an array of numbers, and that turns into a bar chart visualization:
This is one of my earliest interactive articles. On each section of the page, I created the diagrams first, then if any of the controls were used, I would update all the diagrams.
My second example is this diagram from the hexagon page. The main controls at the bottom are the buttons that let you choose flat vs pointy topped hexagons, and hovering the mouse over a hexagon to highlight the rows and columns in the grid:
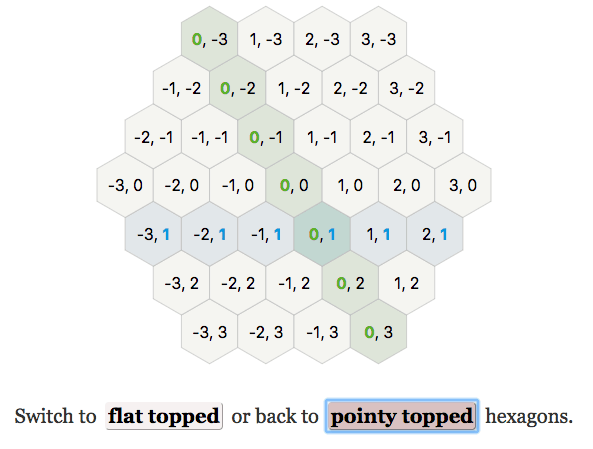
Changing either of the inputs means I need to redraw the diagram. However, I don’t need to run both algorithms. I only run the algorithm necessary for that type of control. On mouseover, I only need to change the hex colors. On orientation change, I only need to change their position and shape, with some animation.
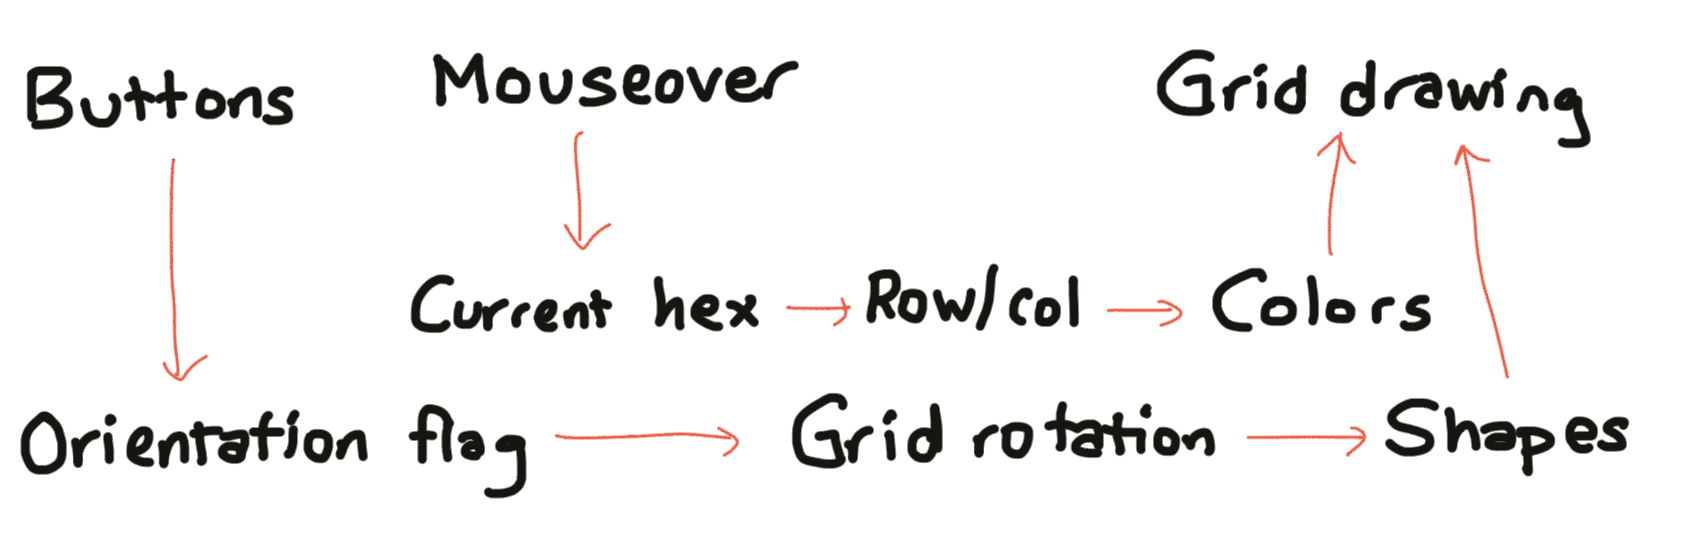
This worked but it wasn’t great. The mouseover was straightforward and didn’t cause any trouble. The problem was the orientation flag. It affected diagrams all over the page. I had to keep track of which diagrams depended on the orientation flag, and update all of them whenever the orientation changed. If I added a diagram that depended on it, and forgot to change the code on those buttons, the diagram wouldn’t be drawn when it should be. If I changed the diagram to not depend on orientation anymore, it would be redrawn when it shouldn’t be. More on this in the next blog post.
For a third example, here are two side by side diagrams on the A* page. One of the controls is a map editor that lets you change the input graph (wall, forest, desert). The other control is the slider with buttons, which changes the input slider position and the input state of the animation (on/off).
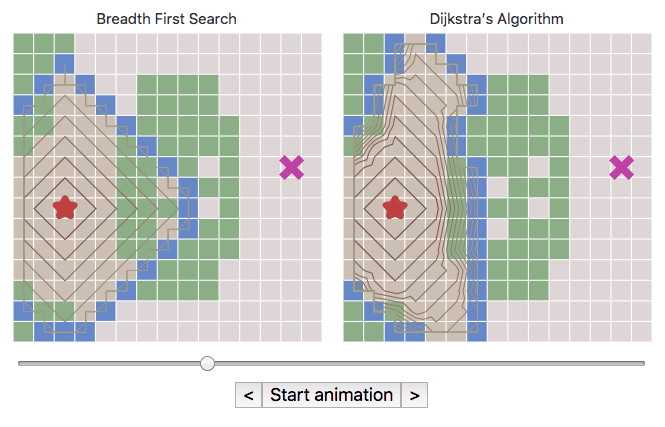
Both diagrams use the same input graph and slider position, but separately run graph search. The play/pause button starts/stops a timer, which updates the slider state. The map displays the current map state, and the contour lines show the result of the graph search algorithm. This is getting complicated! And there are even more complicated diagrams on the page.
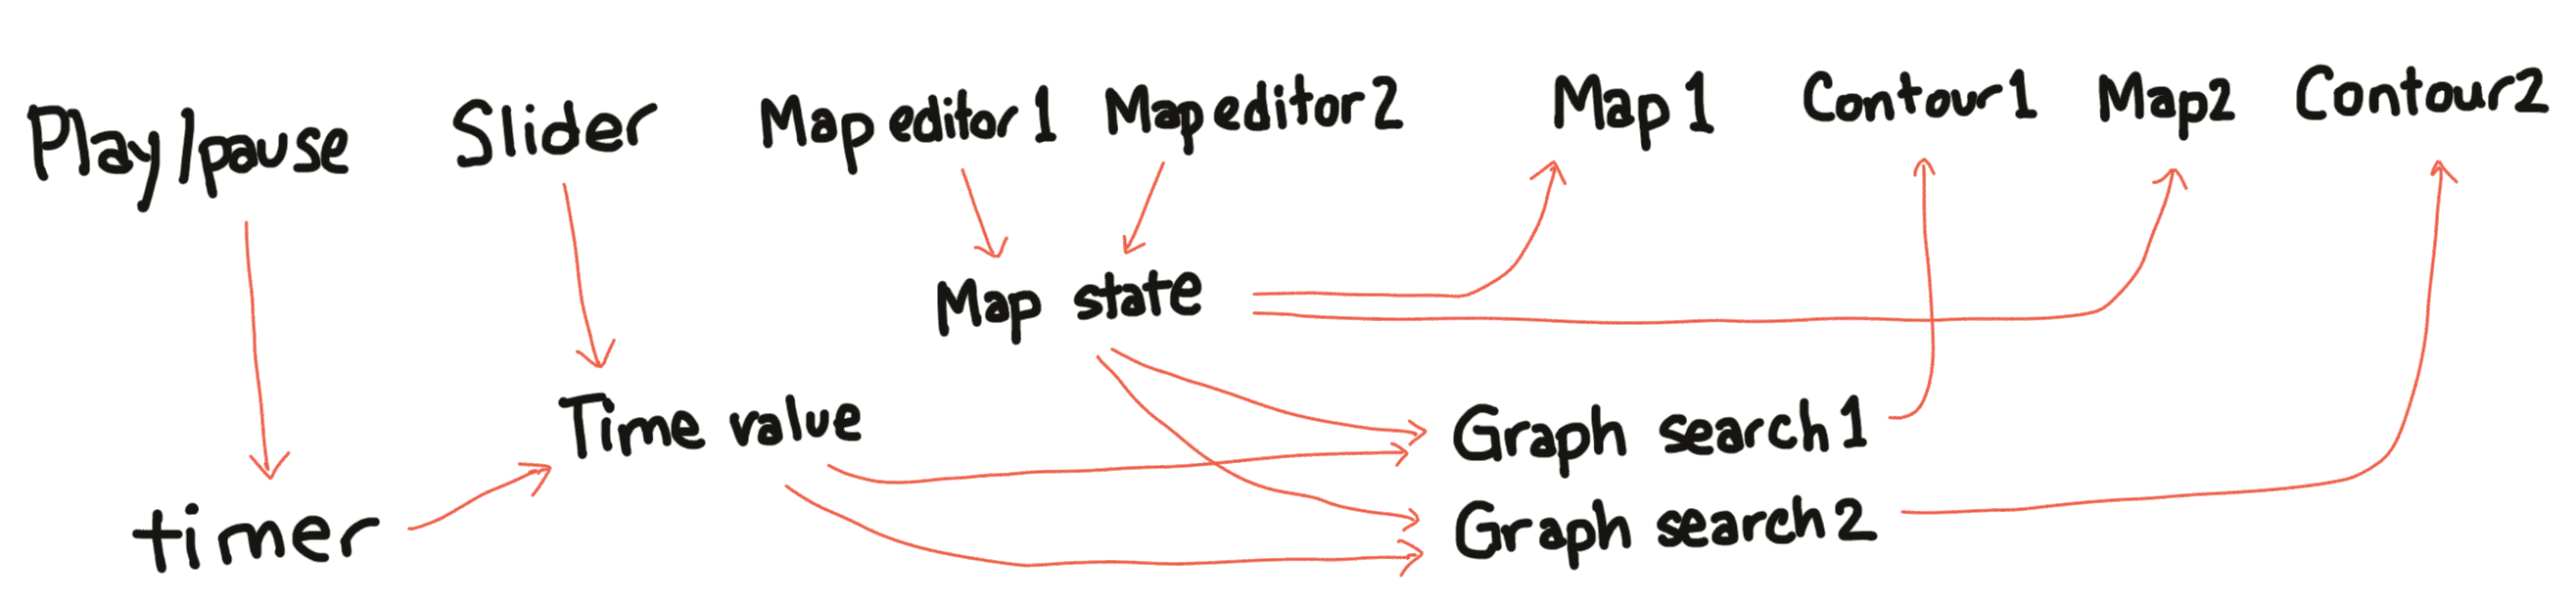
I had learned my lesson from the hexagon page: it’s error prone to manually link everything up, and I should write an abstraction for it. I used the Observer pattern. Both diagram objects register interest in the map state, and then whenever the map state changes, it notifies the diagram objects. That worked nicely.
However, as I added more features it still felt like I was manually linking things up. I ended up redrawing everything any time anything changed.
So let’s get back to the original diagram:
What are the main things to figure out?
- How do I update the visualization?
- Which algorithms do I need to run again?
The easiest answers:
- Erase everything and draw from scratch!
- Run the algorithm again each time! Either every frame or every mouse move.
I like easy. I recommend starting with this approach. Some of my pages were too slow when I did this, so I had to use more complicated approaches. Ideally:
- Reuse as much as possible of the previous visualization output for the new visualization output.
- When one of the inputs changes, run as little as possible (sometimes only parts of the algorithm have to run again)
However, this is a lot of work to implement manually. In the next post I’ll describe the libraries I’ve been looking at, and what approaches can solve these problems.
2 Part 2: dependencies and redrawing#
In the last post I described how I structure my interactive diagrams and gave some examples. In this post I’ll describe what I’d like to do for future diagrams.
When I started writing interactive diagrams I used d3.js, which is a great visualization toolkit. At the time I thought data visualization was the hardest part of what I was doing, and I needed a library for that. Since then, I’ve seen other libraries — React, Riot, Ember, Mithril, Intercooler, Marko, Vue, Aurelia, Ractive, Rax, Svelte, MobX, Moon, Dio, Etch, Hyperapp, S/Surplus, Preact, Polymer, lit-html, Elm, and many more — that have given me different ways to look at the problem. I’ve realized that the visualization isn’t the hardest part of what I’m trying to do. There are two two big problems I want a library to help me with:
- How do I update the visualization?
- Which algorithms do I need to run again?
For deciding how to update the visualization, there’s a spectrum:
- The simplest thing is to redraw everything from scratch. I use d3 or jquery to remove all the existing SVG nodes, and create new ones in their place. If I’m using Canvas instead of SVG, it’s more likely that I’ll redraw everything from scratch.
- If I don’t want to redraw everything (for performance reasons), I can use d3.js’s data joins to help me figure out which parts of the visualization to add, remove, and update. This is great for many data visualization needs, but a bit overkill for most of my projects.
- The next simplest thing is to pretend I’m redrawing everything from scratch, but let the system figure out what actually changed, and only update those things. This is the “virtual DOM” approach used in React and other libraries. This approach wasn’t available when I first started writing interactive tutorials, and I’m only now catching up.
I’ve been using approach 2 but will be trying approach 3 for future projects. It’s simpler to describe what I want than how I want to get there. Also, since I am writing documents instead of web applications, I prefer to describe the output in document form (html/svg) instead of code form (javascript). However, this is just a preference, and you should follow your own preference.
For deciding which algorithms to run again, including calculating the visualization, there’s also a spectrum:
- The simplest thing is to run everything. Easy!
- If I don’t want to run everything (for performance reasons), I can manually decide what to run based on which input control was changed. This is what I do for most of my projects, but it’s error prone. It was especially bad for the hexagon page.
- I can have the algorithms mark which inputs they depend on, and then when those inputs change, the algorithms automatically run again. I did this somewhat for the A* page, which re-runs graph search when the graph data changes.
- I can ask the system to track the data dependencies: which controls each input depends on, which inputs each algorithm depends on, and which algorithms each visualization depends on. Then it can automatically update the right things when a control is changed.
I’ve recently experienced approach 4 with ObservableHQ (see my notebooks[8]), which tracks changes between cells and automatically runs algorithms and visualizations that depend on them. It’s quite refreshing! I tried Vue for this unfinished page[9], and it was a great fit for my needs. I’ve not yet tried Elm, which seems like the coolest approach for dependency tracking and automatic updates.
I’ve mostly been using approach 2 or 3 but will be trying approach 1 or 4 for future projects. Tracking dependencies manually, even if using the Observer pattern, is error prone. In approach 2 the controls have to know which inputs are affected, the inputs have to know which algorithms are affected, and the algorithms have to know which visualizations are affected. In approach 3 the visualizations have to declare which algorithms they care about, the algorithms have to declare which inputs they care about, and the inputs have to declare which controls they care about. Approach 3 is better than 2, but both mean I’m constructing the dependency chain. I’d rather not have to do that. So my options are either not to worry about it, or to use something that automatically handles dependency tracking.
Every once in a while to I like to pause to examine my work and try to figure out what’s time consuming or error prone. I’m hoping switching to a more functional+declarative style will allow me to make interactive tutorials more quickly in the future.